Leaflet Heatmap Layer Plugin
A plugin to create a heatmap layer for Leaflet.
 This plugin is maintained within the actual heatmap.js repository. If you download heatmap.js you also download the latest version of leaflet-heatmap.js.
It was contributed by the community and is currently maintained on github
Documentation
Setup
Add the leaflet-heatmap.js right under the heatmap.js (either in the header or right before closing the body). A HeatmapOverlay instance takes two parameters: the map instance, and a configuration option object.Configuration Options
Configuration options are passed to the plugin in a configuration object.- scaleRadius boolean *optional* default false
whether the radius should be scaled to accordingly to zoom level.
- radius integer *optional* default 15
defines the radius of your datapoints. Important: If scaleRadius is false, radius is measured in pixels. If scaleRadius is true it's measured in the scale of the map.
- useLocalExtrema boolean *optional* default false
this defines whether the heatmap should use a global extrema set via setData/addData OR a local extrema (the maximum and minimum of the currently displayed viewport)
API
- addData
behaves just like the standard heatmap.js addData - setData
also behaves like the standard heatmap.js setData
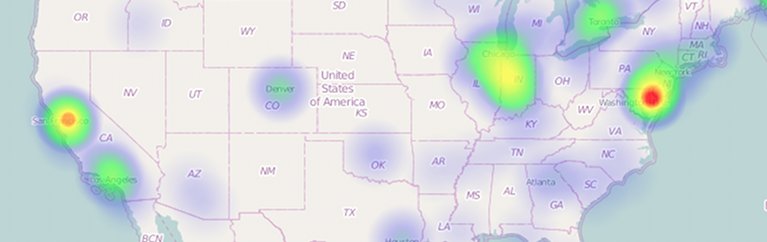
Example
Check out the live example.// don't forget to include leaflet-heatmap.js
var testData = {
max: 8,
data: [{lat: 24.6408, lng:46.7728, count: 3},{lat: 50.75, lng:-1.55, count: 1}, ...]
};
var baseLayer = L.tileLayer(
'http://{s}.tile.openstreetmap.org/{z}/{x}/{y}.png',{
attribution: '...',
maxZoom: 18
}
);
var cfg = {
// radius should be small ONLY if scaleRadius is true (or small radius is intended)
// if scaleRadius is false it will be the constant radius used in pixels
"radius": 2,
"maxOpacity": .8,
// scales the radius based on map zoom
"scaleRadius": true,
// if set to false the heatmap uses the global maximum for colorization
// if activated: uses the data maximum within the current map boundaries
// (there will always be a red spot with useLocalExtremas true)
"useLocalExtrema": true,
// which field name in your data represents the latitude - default "lat"
latField: 'lat',
// which field name in your data represents the longitude - default "lng"
lngField: 'lng',
// which field name in your data represents the data value - default "value"
valueField: 'count'
};
var heatmapLayer = new HeatmapOverlay(cfg);
var map = new L.Map('map-canvas', {
center: new L.LatLng(25.6586, -80.3568),
zoom: 4,
layers: [baseLayer, heatmapLayer]
});
heatmapLayer.setData(testData);